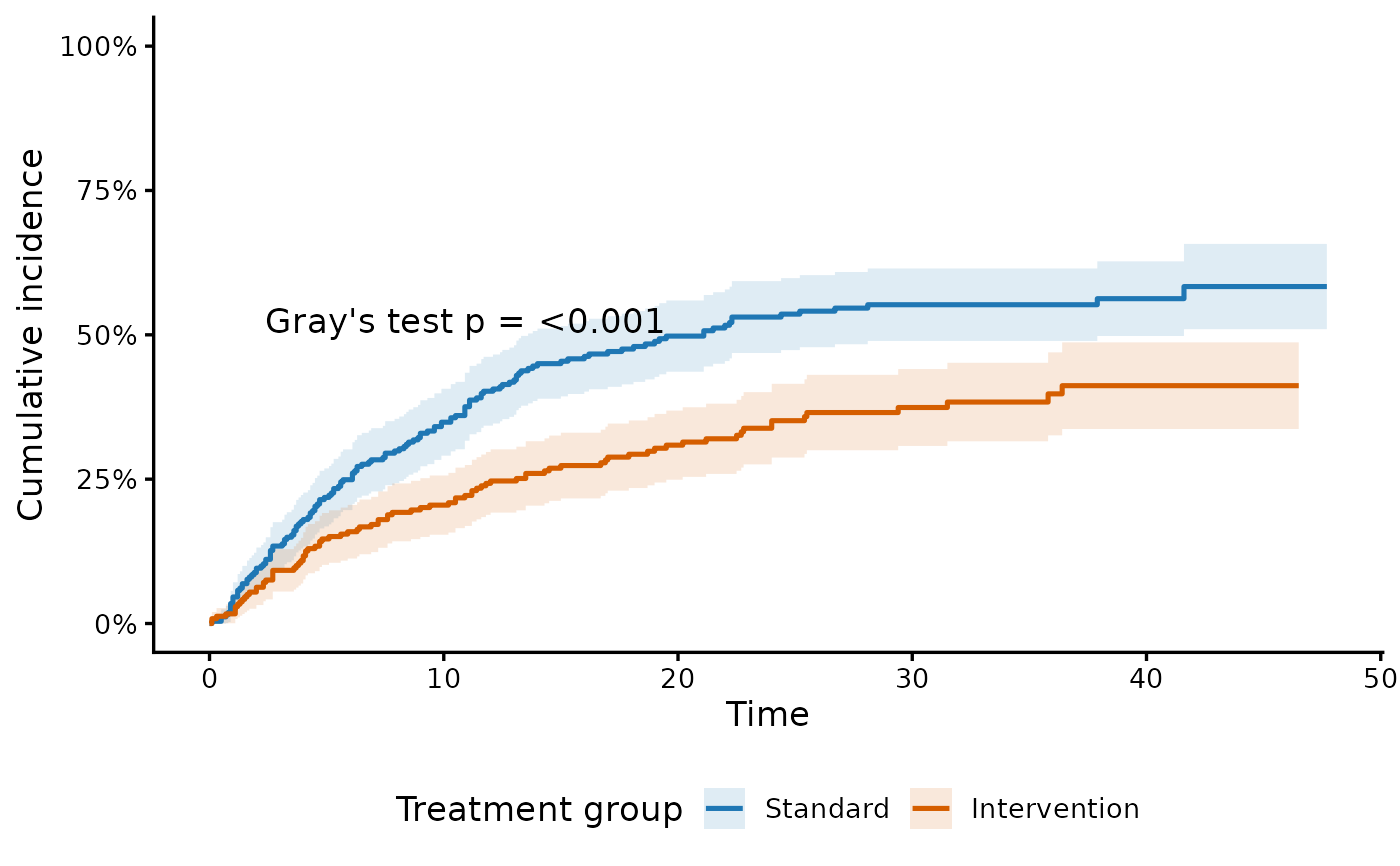
Estimate and plot the cumulative incidence of one event in the presence of competing events, with optional group comparison using Gray's test.
Usage
cuminc_plot(
  data,
  time,
  event,
  event_of_interest,
  censor_code = 0,
  by = NULL,
  conf.int = TRUE,
  p_value = TRUE,
  p_value_position = NULL,
  break_time_by = NULL,
  xlim = NULL,
  ylim = NULL,
  xlab = "Time",
  ylab = "Cumulative incidence",
  title = NULL,
  subtitle = NULL,
  caption = NULL,
  legend_title = NULL,
  legend_position = NULL,
  palette = NULL,
  y_percent = TRUE,
  theme = "classic",
  grid = FALSE,
  base_size = 13
)
Arguments
- data
A data frame containing follow-up time and event status.
- time
Follow-up time. Quoted and bare column names are accepted.
- event
Event-status variable with one censoring code and distinct codes for each event type. Quoted and bare column names are accepted.
- event_of_interest
Code or label for the event to plot. This must be an observed value of `event` and must differ from `censor_code`.
- censor_code
Code or label identifying censored observations. Defaults to `0`.
- by
Optional single grouping variable. When supplied, separate curves are drawn and Gray's test compares groups for the event of interest. Groups are ordered by factor level (as in
km_plot()).- conf.int
Logical; show pointwise 95 percent confidence intervals.
- p_value
Logical; display Gray's test p-value when `by` is supplied.
- p_value_position
Optional numeric vector of length two giving the x and y coordinates of the p-value annotation.
- break_time_by
Optional positive interval for x-axis breaks.
- xlim, ylim
Optional numeric vectors of length two, given as
c(lower, upper), defining plot limits. The plot is zoomed to these limits; no data are removed.- xlab, ylab
Axis labels.
- title, subtitle, caption
Optional plot text.
- legend_title
Optional legend title. The display label of `by` is used by default.
- legend_position
One of `"bottom"`, `"top"`, `"right"`, `"left"`, or `"none"`.
- palette
Optional character vector of curve colors.
- y_percent
Logical; display cumulative incidence as percentages.
- theme
One of `"classic"`, `"minimal"`, `"bw"`, or `"light"`.
- grid
Logical; show major grid lines.
- base_size
Base font size.
Value
A `ggplot2` object with attributes `fit`, `plot_data`, `gray_test`, `event_of_interest`, and `censor_code`.
Details
Cumulative incidence estimates the absolute probability of the selected event over time while correctly retaining competing events in the risk process. Treating competing events as ordinary censoring with a Kaplan-Meier curve generally overestimates event probability.
Gray's test compares cumulative-incidence functions between groups. It is a group comparison and not an adjusted effect estimate; use `competing_risk_reg()` when a subdistribution hazard ratio is required.