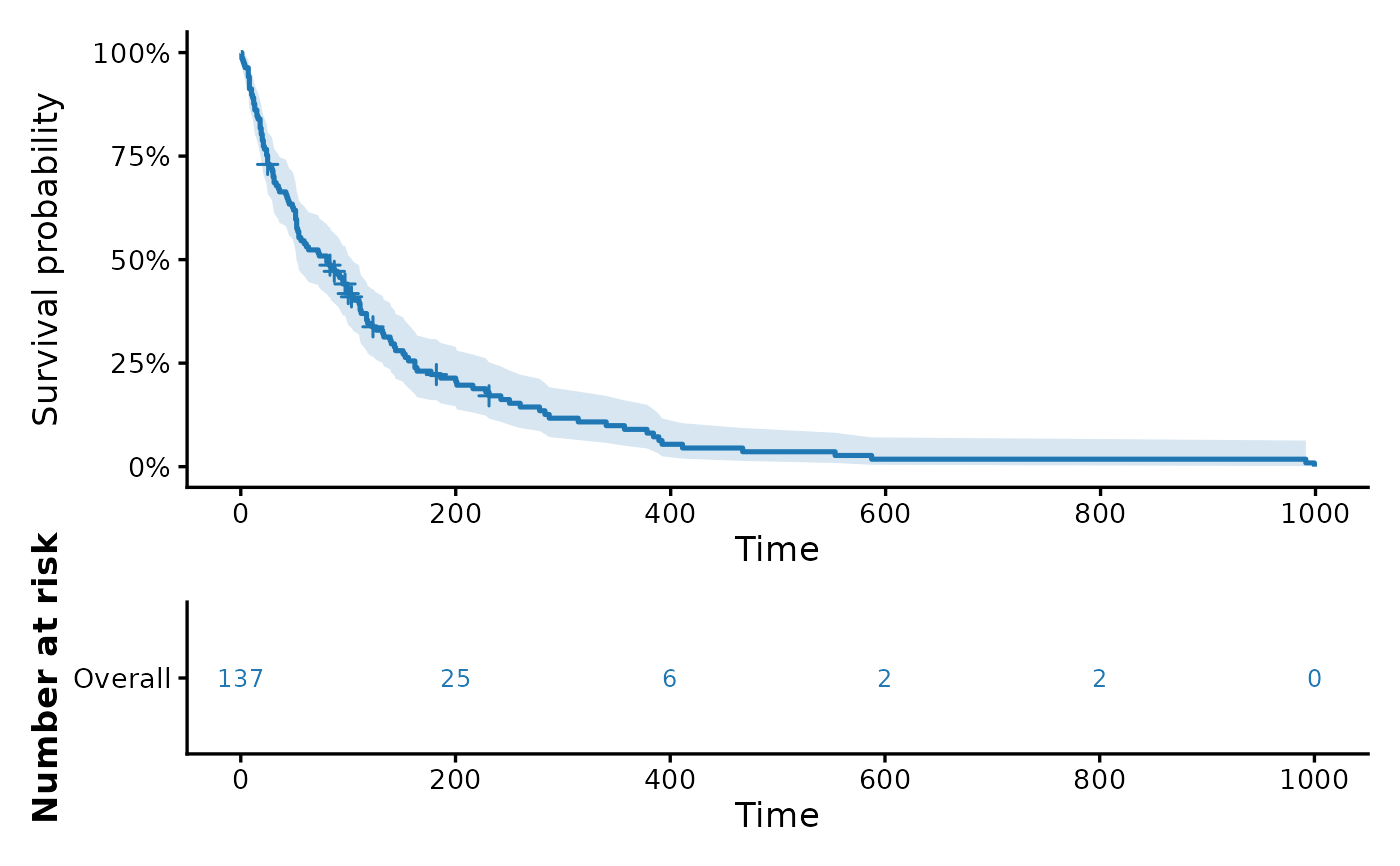
Plot observed survival over time, with optional confidence intervals, censoring marks, a log-rank p-value, and a number-at-risk table.
Usage
km_plot(
  data,
  time,
  event,
  by = NULL,
  conf.int = TRUE,
  risk_table = TRUE,
  p_value = TRUE,
  p_value_position = NULL,
  censor = TRUE,
  break_time_by = NULL,
  xlim = NULL,
  ylim = NULL,
  xlab = "Time",
  ylab = "Survival probability",
  title = NULL,
  subtitle = NULL,
  caption = NULL,
  title_size = NULL,
  title_face = "bold",
  legend_title = NULL,
  legend_position = NULL,
  palette = NULL,
  y_percent = TRUE,
  theme = "classic",
  grid = FALSE,
  base_size = 13
)
Arguments
- data
A
data.framecontaining survival time and event status.- time
Survival follow-up time. Quoted and bare names are accepted.
- event
Event indicator. Quoted and bare names are accepted. Numeric
0/1, numeric1/2, logical, character, and factor variables are accepted. For two-level character or factor variables, the second level is treated as the event.- by
Optional grouping variable for separate Kaplan-Meier curves. Quoted and bare names are accepted.
- conf.int
Logical; if
TRUE, show confidence limits.- risk_table
Logical; if
TRUE, add a number-at-risk table below the curve.- p_value
Logical; if
TRUE, show the log-rank p-value whenbyis supplied.- p_value_position
Optional numeric vector of length 2 giving the
xandycoordinates for the log-rank p-value inside the plotting panel. IfNULL, a lower-left position is chosen automatically.- censor
Logical; if
TRUE, show censoring marks.- break_time_by
Optional numeric interval for x-axis and risk-table time breaks. If
NULL, breaks are chosen automatically.- xlim
Optional numeric vector of length 2 specifying x-axis limits.
- ylim
Optional numeric vector of length 2 specifying y-axis limits. Values may be supplied on the survival-probability scale (for example
c(0.5, 1)) or, wheny_percent = TRUE, on the percentage scale (for examplec(50, 100)).- xlab, ylab
Axis labels.
- title
Optional plot title.
- subtitle
Optional plot subtitle.
- caption
Optional plot caption.
- title_size
Optional numeric title font size. If
NULL, ggplot2's theme default is used.- title_face
Font face for the title. One of
"plain","bold","italic", or"bold.italic". Quoted and bare values are accepted.- legend_title
Optional legend title. If
NULL, the labelledbyvariable name is used.- legend_position
Legend position. One of
"bottom","top","right","left", or"none". IfNULL, grouped plots use"bottom"and ungrouped plots hide the legend. Quoted and bare values are accepted.- palette
Optional character vector of colors for grouped curves.
- y_percent
Logical; if
TRUE, display survival probability as percentages. IfFALSE, display the raw 0 to 1 probability scale.- theme
Plot theme. One of
"classic","minimal","bw","light", or"none". Quoted and bare values are accepted.- grid
Logical; if
TRUE, show major grid lines. The default isFALSEfor a cleaner publication-style Kaplan-Meier plot.- base_size
Base font size.
Value
A ggplot2 object when risk_table = FALSE; otherwise a
patchwork object combining the survival curve and risk table. The
returned object has attributes fit, plot_data,
risk_table, and logrank_p.
Examples
lung_data <- data_lungcancer
lung_data$trt <- factor(lung_data$trt, levels = c(1, 2),
labels = c("Standard", "Test"))
km_plot(
data = lung_data,
time = time,
event = status
)
 km_plot(
data = lung_data,
time = time,
event = status,
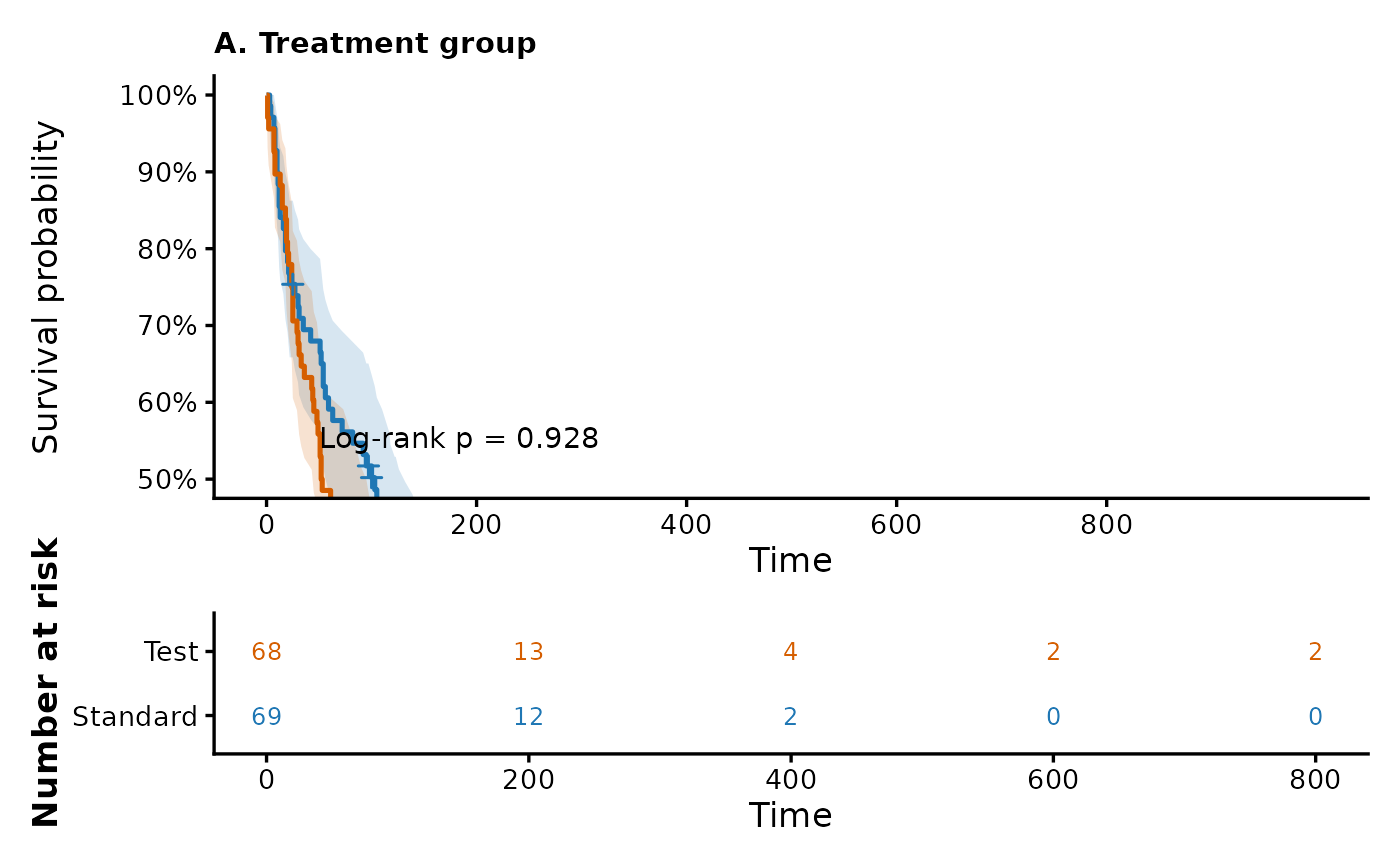
by = trt,
break_time_by = 200,
ylim = c(50, 100),
title = "A. Treatment group",
title_size = 11,
legend_position = "none"
)
km_plot(
data = lung_data,
time = time,
event = status,
by = trt,
break_time_by = 200,
ylim = c(50, 100),
title = "A. Treatment group",
title_size = 11,
legend_position = "none"
)