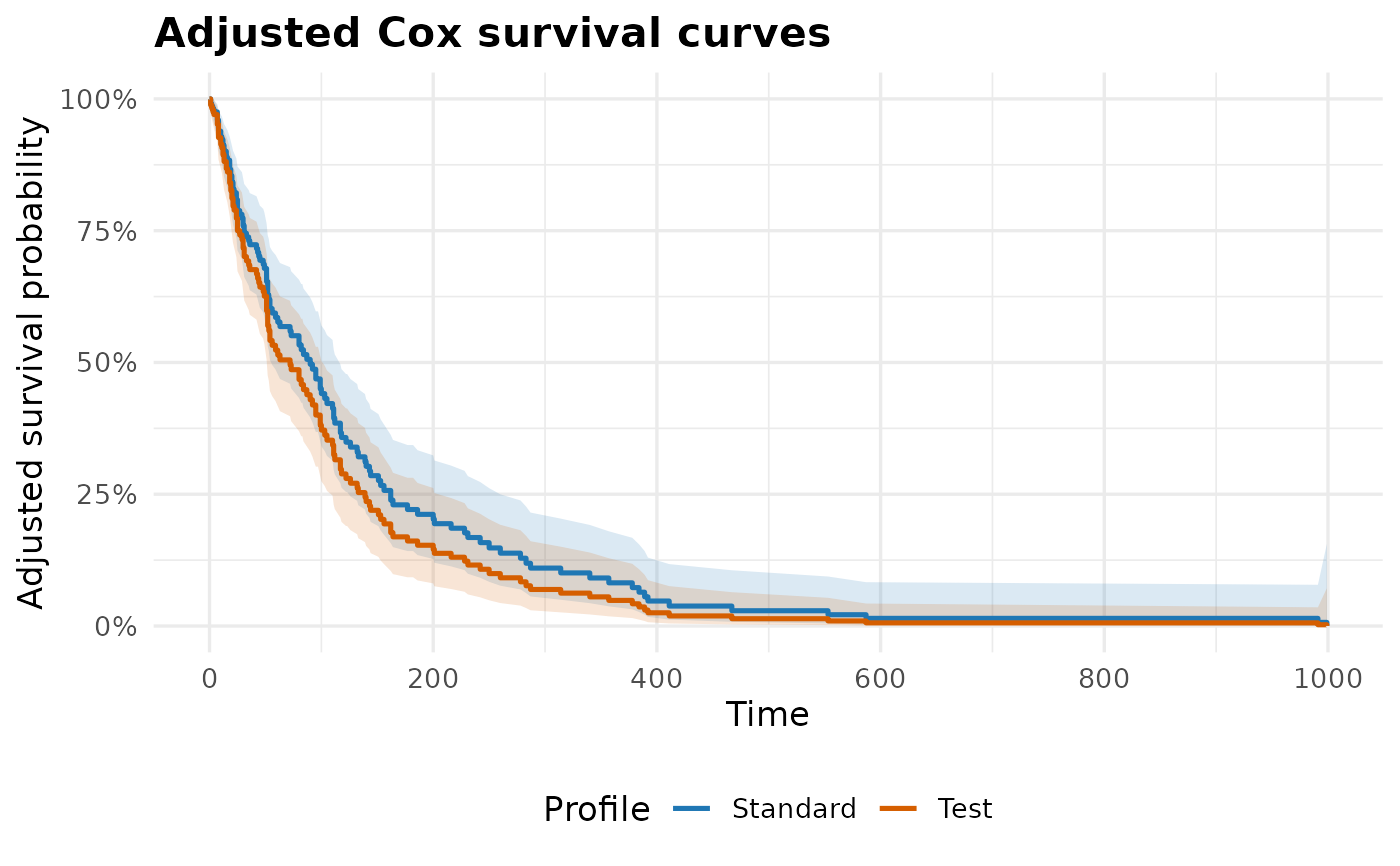
Plot model-based survival curves from a fitted Cox proportional hazards model at user-supplied or representative covariate profiles.
Usage
plot_cox_survival(
  model,
  model_name = NULL,
  newdata = NULL,
  by = NULL,
  conf.int = TRUE,
  break_time_by = NULL,
  xlim = NULL,
  xlab = "Time",
  ylab = "Adjusted survival probability",
  title = "Adjusted Cox survival curves",
  legend_title = "Profile",
  palette = NULL,
  base_size = 13
)
Arguments
- model
A fitted
coxphmodel or acox_reg()result fitted withoutstratifier. Models with a stratified baseline hazard (strata()terms, orcox_reg(baseline_strata = )) are supported; see Details.- model_name
Model name or position when a
cox_reg()result contains more than one fitted model.- newdata
Optional data frame containing one covariate profile per curve. Row names are used as curve labels when available.
- by
Optional model variable used to generate one curve per observed level. Other model variables are held at representative values. Ignored when
newdatais supplied.- conf.int
Logical; display pointwise confidence bands.
- break_time_by
Optional numeric interval for x-axis breaks.
- xlim
Optional numeric vector of length 2 specifying x-axis limits.
- xlab, ylab
Axis labels.
- title
Optional plot title.
- legend_title
Legend title.
- palette
Optional character vector of curve colours.
- base_size
Base font size.
Value
A ggplot2 object with attributes survfit,
plot_data, and prediction_data. plot_data has one
row per time point and curve, with columns profile and
stratum identifying the curve.
Details
For a model with a stratified baseline hazard, each covariate profile has a
different survival curve in every baseline stratum. One curve is therefore
drawn per profile and stratum: with a single profile the strata are
distinguished by colour; with several profiles, colour identifies the
profile and line type identifies the stratum. The stratum variables are not
covariates and cannot be used in by. If newdata contains the
stratum variables, each row is drawn only for its own stratum.