Wrapper around forestploter::forest() that works directly with
forest_df() output or with gtregression regression objects.
It can show descriptive columns and one or more model effect columns in a
table-style forest plot while leaving axis and interval drawing to
forestploter.
Usage
forest_reg(
  df = NULL,
  uni = NULL,
  multi = NULL,
  desc = NULL,
  theme = NULL,
  ci_col_width = 20,
  side = c("right", "left"),
  quiet = TRUE,
  effects = NULL,
  ticks_at = NULL,
  ticks_digits = NULL,
  xlim = NULL,
  style_strata = TRUE,
  strata_fill = "#EAF2F1",
  ...
)
Arguments
- df
Output of
forest_df(). IfNULL, it is built fromuni,multi, anddesc.- uni, multi, desc
Optional
gtregressionobjects to pass through toforest_df().- theme
Optional
forestploter::forest_theme(). IfNULL,forestploterdefaults are used. You may pass colors and styling either here or through....- ci_col_width
Numeric value, or one value per effect column, controlling the blank spacer width used by
forestploterfor the confidence-interval plot column(s). Values greater than 1 are interpreted as approximate character counts. Values between 0 and 1 are accepted for backward compatibility and converted to character counts.- side
Character. For each effect, position of the plot relative to the effect-size text:
"left"= plot first then text;"right"= text first then plot. TheCharacteristiccolumn and descriptive columns remain on the left.- quiet
Logical. Suppress forestploter warnings. Default = `TRUE`.
- effects
Optional effect labels passed to
forestploter::forest().- ticks_at
Optional numeric vector, or list of numeric vectors for multiple effect columns, specifying x-axis tick positions. If
NULL,forestploter::forest()chooses the default ticks.- ticks_digits
Optional number of digits for x-axis tick labels.
- xlim
Optional numeric vector of length 2, or list of length-2 numeric vectors for multiple effect columns, specifying x-axis limits. If
NULL,forestploter::forest()chooses the default limits.- style_strata
Logical. Retained for older vertically grouped stratified forest data. Current
forest_df()stratified output places strata side by side, so no stratum header rows are styled.- strata_fill
Character. Fill color used for older styled stratum header rows.
- ...
Passed to
forestploter::forest(). Common options includetitleandfootnote.
Value
A gtregression_forest object with elements:
plotThe forest plot object.
dataThe plotting data sent to
forestploter::forest().input_dataThe original
forest_df()data, including standard-error helper columns.metaModel metadata, including reference line and x-axis transformation.
Examples
birthwt_data <- data_birthwt |>
transform(
smoke = factor(smoke, levels = c(0, 1), labels = c("No", "Yes")),
ht = factor(ht, levels = c(0, 1), labels = c("No", "Yes")),
low = factor(low, levels = c(0, 1),
labels = c("Normal BW", "Low BW"))
)
uni_or <- uni_reg(
birthwt_data,
outcome = "low",
exposures = c("age", "lwt", "smoke", "ht"),
approach = "logit"
)
multi_or <- multi_reg(
birthwt_data,
outcome = "low",
exposures = c("smoke", "ht"),
adjust_for = c("age", "lwt"),
approach = "logit"
)
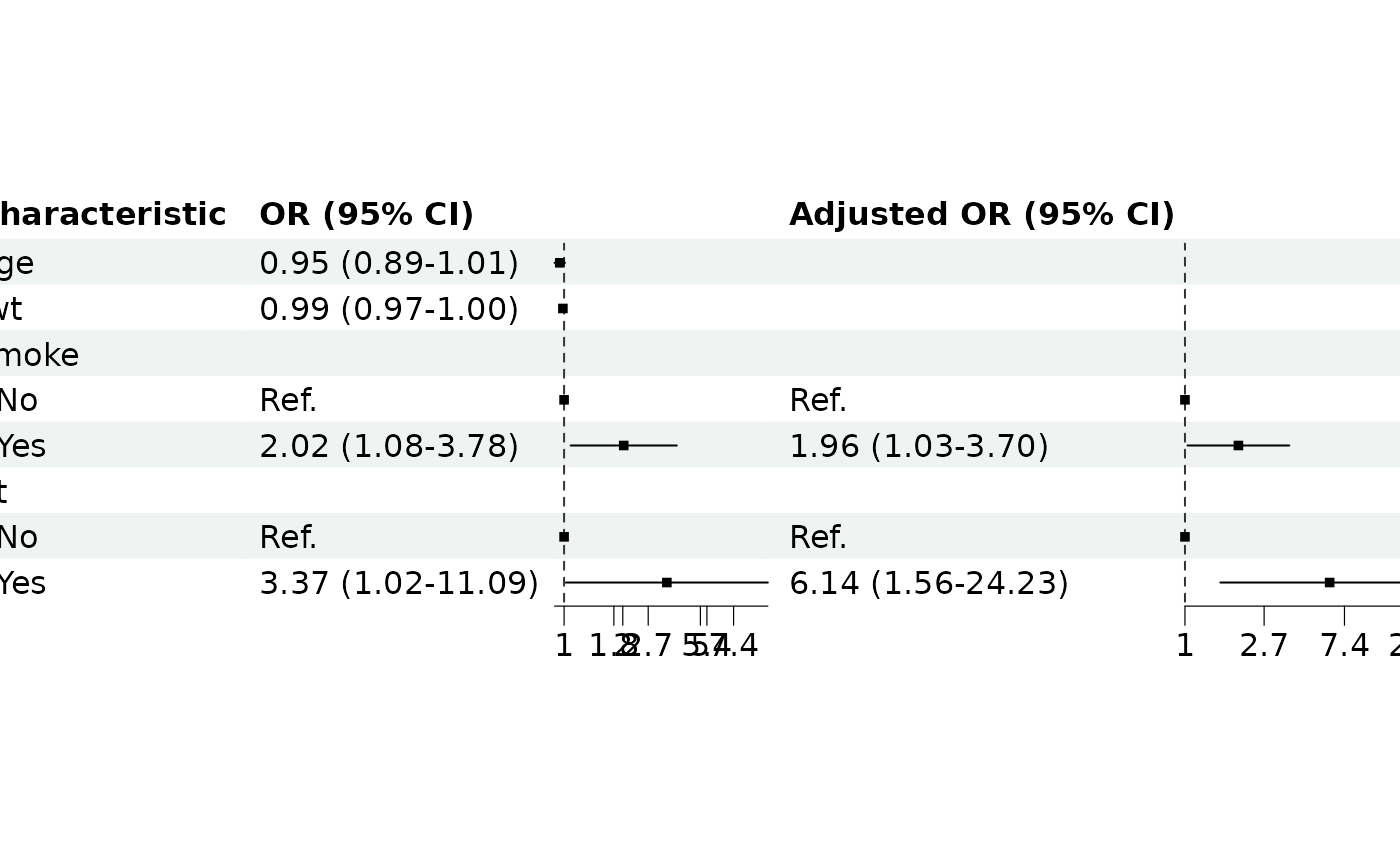
forest_reg(uni = uni_or, multi = multi_or)
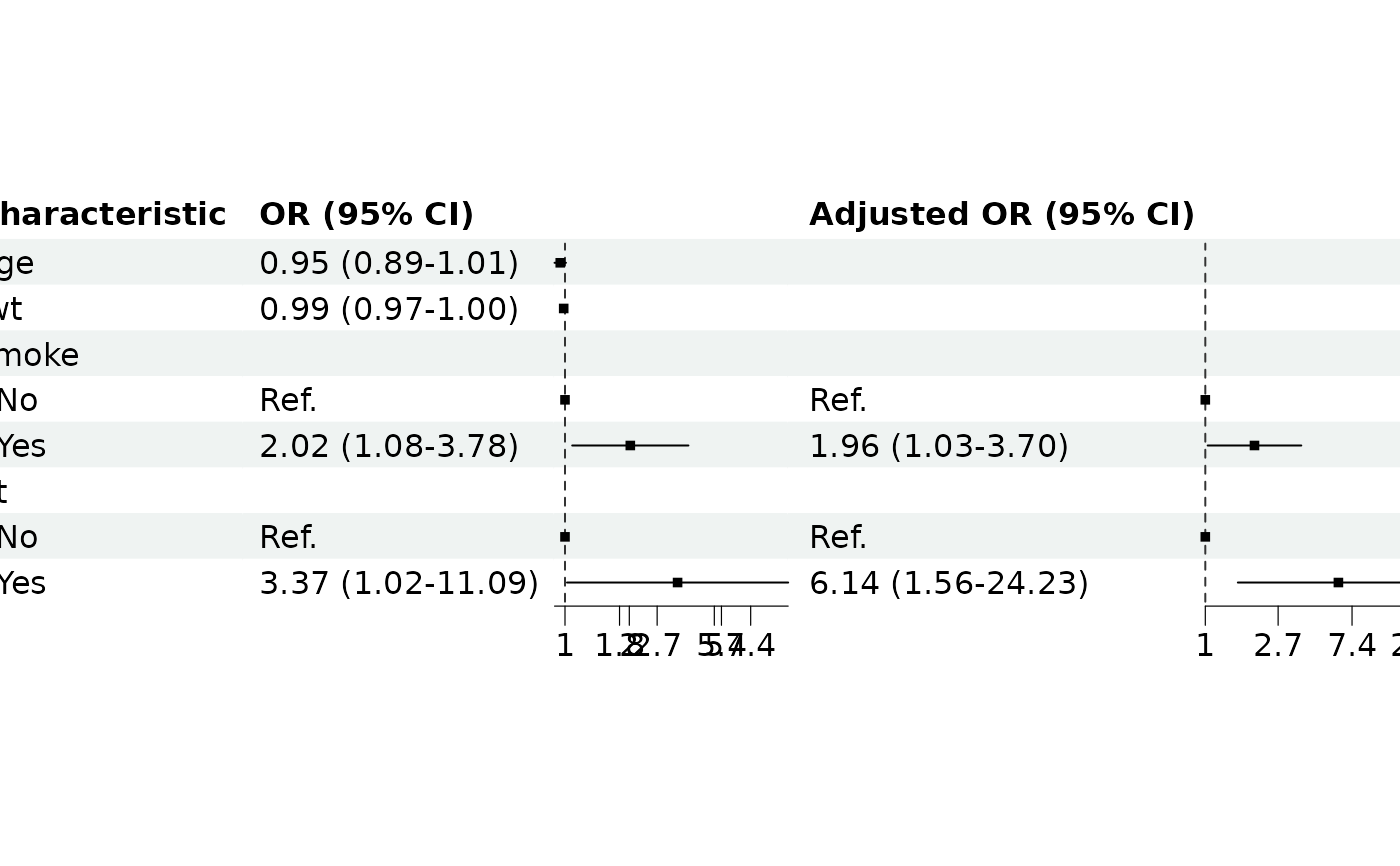 # If axis labels overlap, set x-axis limits and tick marks.
forest_reg(
uni = uni_or,
multi = multi_or,
xlim = list(c(0.25, 8), c(0.25, 12)),
ticks_at = list(c(0.5, 1, 2, 4, 8), c(0.5, 1, 2, 4, 8))
)
# If axis labels overlap, set x-axis limits and tick marks.
forest_reg(
uni = uni_or,
multi = multi_or,
xlim = list(c(0.25, 8), c(0.25, 12)),
ticks_at = list(c(0.5, 1, 2, 4, 8), c(0.5, 1, 2, 4, 8))
)
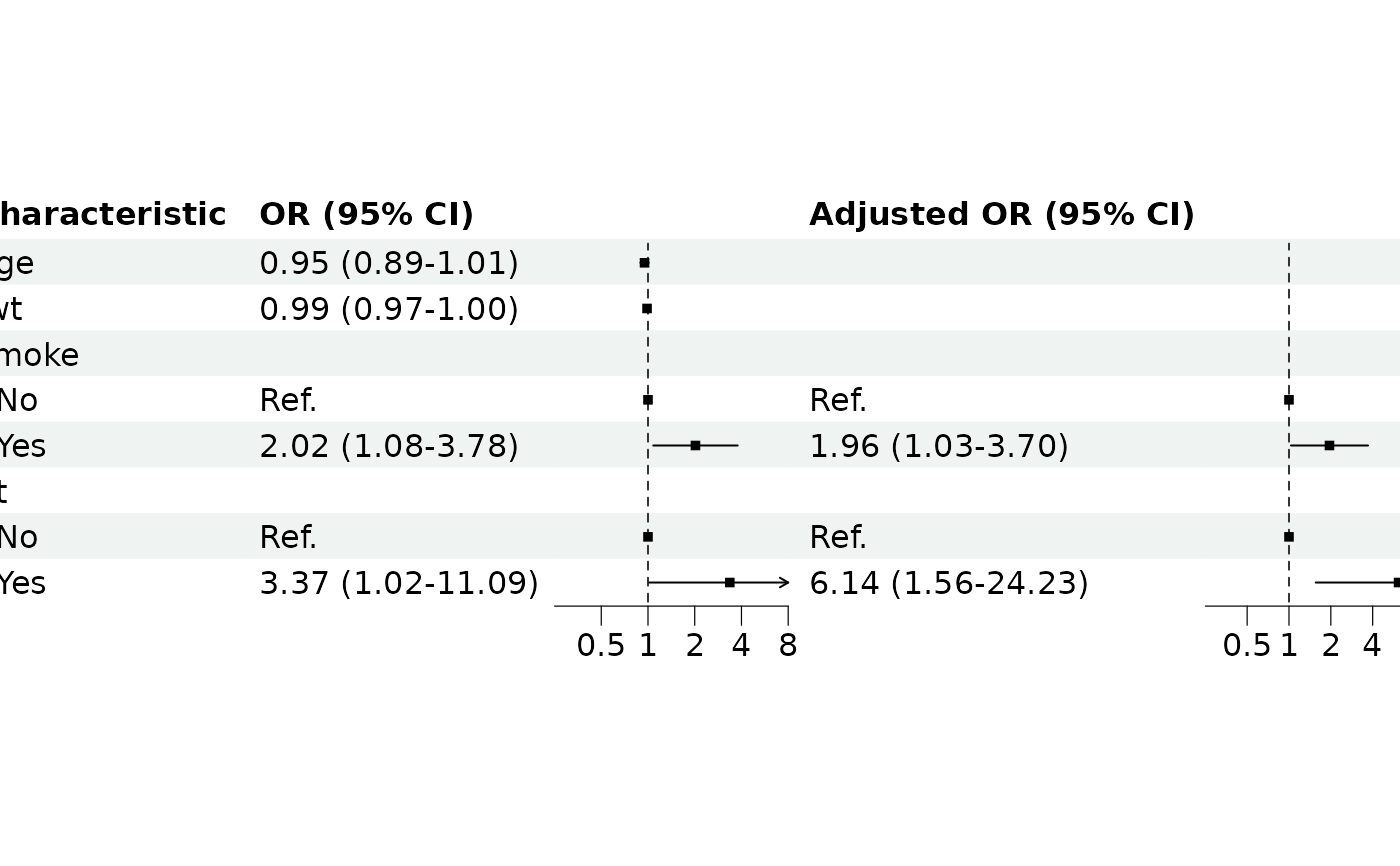 # If the forest plot panel is too narrow or too wide, tune ci_col_width.
forest_reg(
uni = uni_or,
multi = multi_or,
ci_col_width = c(18, 22)
)
# If the forest plot panel is too narrow or too wide, tune ci_col_width.
forest_reg(
uni = uni_or,
multi = multi_or,
ci_col_width = c(18, 22)
)